Feb 2nd, 2024
Creating a Dynamic Pie Chart using Super.Human.Installer™ and Moonshine IDE™
We’re excited to share with you a step-by-step guide on creating a dynamic pie chart using some incredible tools. Whether you’re a seasoned developer or just starting out, this walkthrough promises to be both informative and enjoyable!
Data visualization plays a pivotal role in business settings, serving as an essential tool for decision-making, communication, and presentation. In an era where data is continuously growing in volume, complexity, and speed, the ability to effectively visualize data is not just a luxury but a necessity. Tools like Apache ECharts, an open-source JavaScript visualization library, offer a wide array of customizable chart options, including dynamic pie charts, which are excellent for representing part-to-whole relationships and making comparative analysis intuitive and impactful. For more information and to explore the library’s features, visit the Apache ECharts website .
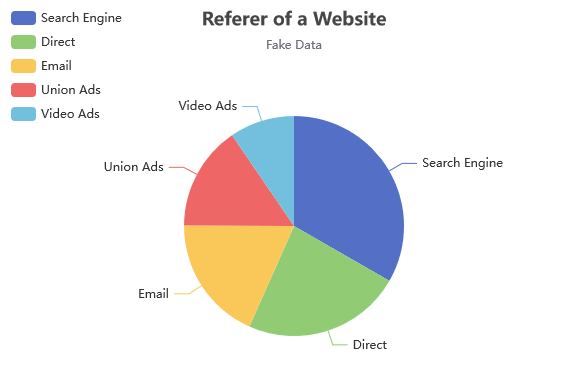
In this tutorial, we’ll guide you through setting up a virtual machine that hosts a Domino database, which will store data detailing the number of website visits per referrer. To make this data accessible, we’ll implement a REST API managed by Java Agents. On the frontend, we will deploy two Apache Royale projects. The first project is designed for efficiently editing the data, ensuring a user-friendly experience. The second project focuses on data representation, where we will create a dynamic pie chart to visually display the website visit statistics. This chart implements an example from ECharts website, as shown here:
Getting Ready: Tools of the Trade
Before diving in, let’s make sure we have all the necessary tools:
- VirtualBox: This is a fantastic, free open-source hosted hypervisor for x86 virtualization. It’s going to be the backbone of our setup.
- Vagrant: A superb tool for building and managing virtual machine environments. It makes handling different development environments a breeze.
- Super.Human.Installer™: The key to setting up your server environment efficiently. This makes things a lot easier!
The First Steps: Setting Up Your Environment
Setting up your environment correctly is crucial. Here’s how to do it:
- Installing the Essentials:
- First, grab and install VirtualBox, Vagrant, and Super.Human.Installer™. These tools are going to be the foundation of our project.
- Server Time:
- Next up, set up at least one server with Domino 12.0.1. Warning: You need to use this exact version, Domino 12.0.1 for the example to work
- You can find detailed instructions at superhumaninstaller.com. Remember to note down your hostname and organization certifier.
- When finished your configuration should look like this:

In this example we’re using
marsas the hostname andplanestsas the certifier.- Start the server and wait for the provisioning process to complete. When done, the server entry should look like this:

- A welcome page should open up automatically. You can always bring it back clikcing on the world icon.

- Don’t forget to set up etc/hosts! Without it, the mapping between your hostname/certifier and your local IP address will not work. Follow the instructions on the welcome page and try accessing link 2) Portal. If you can access it, everything is set up correctly.
Crafting the Development Environment
With our server ready, let’s set up the development environment:
- Moonshine IDE™ & SDK:
- Download and install the latest Moonshine IDE™. To follow along you will need the lastes development version

Also download Moonshine SDK Installer. These will be our tools for the actual development process.
- Preparing the Tools:
- Use the SDK Installer to download the latest Apache Royale nightly version. It is needed for out frontend projects.

- Open
File -> Settings, chooseVagranttab and make sure that the server instance you created is visible in Moonshine IDE™.


- Optional: If you don’t see your server instance automatically, you can attempt a manual connection. First, click the plus button at the bottom of the Vagrant settings page. Then enter:
Label: mars.planets.com
Base URL: http://restapi.mars.planets.com:8080
where ‘mars’ is your hostname and ‘planets’ is your certifier. The local path can be left blank. Finally, ensure that you see a green checkmark next to ‘Status: Ready’.

Building the Pie Chart Database Project
Now, the fun part begins – creating the Pie Chart!
- Project Setup:
- Open Moonshine IDE™ and go to
File -> New -> Domino on Disk Project. Name your projectPieChartNsfand click ‘Create’.
- Open Moonshine IDE™ and go to
- Configuration:
- Right-click on the project in the project list, go to
Settings -> Domino Tab -> Target Server, and enter your hostname and organization certifier. In our case, it’smars/planets. Don’t forget to save these settings!
- Right-click on the project in the project list, go to

- Designing the Database:
- Navigate to
src/main/formbuilder/PieChartNsf.dfbin your project and open it. This is where we’ll be adding the data for our pie chart.
- Navigate to

- Adding Data:
- We’ll input data in the form of country names and their corresponding percentage areas. ECharts pie chart expects data in ‘name’ and ‘value’ pairs, and that’s exactly how we’ll set up our columns.
- Click the ‘Add’ button to create the name field. Use
Name: name
Label: referer
Type: Text

- Add the value field. Use
   Name: value
   Label: visits
   Type: number

- The Final Look:
- Once you’ve added your data, the table should look something like this (refer to the screenshots for a visual guide).

Building and deploying database and agents
-
With the PieChartNsf project selected, go to
Project -> Build on Vagrant. Choose the server you set up earlier.
- With the project still selected, go to
Project -> Deploy Domino Database - Now it’s time to create Java Agents responsible for fetching and updating the data. Go to
Project -> Generate Java Agents. When prompted, select the parent directory, so Java Agents are next to your NSF project. - Now select the Java Agents project, and go to
Project -> Run on Vagrant. Wait for the agents to deploy.
Creating Apache Royale CRUD project
In this stage of our tutorial, we are utilizing two Apache Royale projects to demonstrate a comprehensive data management and visualization workflow. The first is an auto-generated CRUD (Create, Read, Update, Delete) project, tasked with communicating with Java Agents for modifying the database. This includes creating, editing, and removing records. The second component is an Apache ECharts project, dedicated to presenting this data through an illustrative pie chart. For practicality, we have sourced a template project from GitHub to expedite this process. While it’s entirely feasible to integrate these two projects into a single entity, for clarity and ease of understanding in this example, we will maintain them as separate projects.
- With
PieChartNsfproject selected, go toProject -> Generate Apache Royale Project. Select the parent directory, so thePieChartNsfRoyaleApplicationsits next to the Nsf and JavaAgents projects. - Right click newly creted project and go to
Settings. ChooseBuild Options,Custom SDKand point to the latest Apache Royale nightly version (which you can download with Moonshine SDK Installer). - Go to
Project -> Build Projectto build on your local machine first. - With Apache Royale Application project selected, go to
Project -> Deploy on Vagrant Server. Your URL should be populated automatically like this:http://domino.mars.planets.com/PieChartNsfRoyaleApplication/js-debug/index.htmlwhere ‘mars’ and ‘planets’ are your hostname and certifier. ClickSubmit. - The CRUD interface welcome page shuld open:

- Use the web interface to populate the data like this:

Using Apache Royale ECharts template
- Download the example repository: https://github.com/Moonshine-IDE/PieChartExample
- Extract the zip file and copy PieChartRoyale folder, so it sits next to PieChartNsf and PieChartNsf_JavaAgents folders.
- In Moonshine IDE™, go to
Project -> Open/Import Projectand select PieChartRoyale. - Right click on the PieChartRoyale project. Go to
Settings -> Build Options -> Custom SDKand select the latest Apache Royale nightly version. - Go to
Project -> Build Projectto build locally. - Then, go to
Project -> Deploy to Vagrant Serverand choose your created server. - Your URL should be populated automatically: https://domino.mars.planets.com/PieChartRoyale/js-debug/index.html with your hostname and certifier replaced.
This is the final result of the Pie Chart project:

And there you have it! By following these steps, you’re well on your way to creating a dynamic and visually appealing pie chart. Stay tuned for more posts where we delve deeper into customizing and enhancing our chart.
Happy coding!